In this assignment, the objective was to learn about calculating volumetric data of stockpiles at the Litchfield mine with Pix4D and ArcMap. Now that processing imagery, using GCPs, and creating DSMs and Orthomosaics are familiar, this lab will expand on that knowledge to produce some extremely useful volumetric data. Calculating volumes of a given object could be extremely useful in mining operations or mineral/ gravel businesses for determining how much product they have in their stockpiles.
In order to perform the analysis, the following tools were used in ArcMap:
Extract by Mask - this tool works much like a clip tool in that the user puts in an input raster and a clip extent, known as the "mask" in this tool's name. The feature mask can be a raster or feature dataset.
Raster to TIN - a tool used to convert raster files to a triangulated irregular network (TIN) dataset. The tool works by taking the original raster file's z-values and creating a triangular representation of the (usually digital elevation model [DEM]) within a certain z-tolerance (allowable difference between z-values of raster and the generated TIN).
Add Surface Information - this tool adds information about a certain raster, TIN, or terrain surface's surface elevation properties (specified by the user) to the attribute table of the input feature class. This tool can add z values, z minimum values, z maximum values, z mean values, surface area, slope length, minimum slope, maximum slope, and average slope.
Surface Volume - a tool used for calculating the area and volume of an area between a surface plane (raster, TIN, or terrain surface) and the reference plane (layer's spatial reference). The user has the option to calculate volumes above or below the reference plane.
Polygon Volume - similar to the surface volume tool, this tool calculates the volume and surface area between a polygon feature class and a terrain or TIN surface. The volumes and surface area calculations extend as far as the dimensions of the polygon go. The user again has the option to calculate volumes above or below the reference plane.
Cut Fill - this tool is used to determine differences in surfaces over time. The tool works by comparing the surfaces of two separate surface datasets (raster, TIN, terrain surface) and then calculating the volumes of difference between the two datasets.
Methods
Once the tools in the previous list were familiar, the calculating volumes process could begin. The first step was to process the imagery of the mine flight. Since the mine imagery had already been processed (and with GCPs) in a previous assignment, that Pix4D file was used. First, the volumes tab for the orthomosaic was opened and the new volume button was chosen. The next step was to digitize around the stockpiles and calculate volumes. In figure 1, the calculated volumes are shown in the windows on the left-hand side of the image. The digitized stockpiles are shown on the right-hand side.
 |
| Figure 1: Digitized stockpiles and calculated volumes. |
 |
| Figure 2: Extract by mask step. |
 |
| Figure 3: Surface Volume tool. |
 |
| Figure 4: Surface Volume output table. |
 |
| Figure 5: Raster to TIN tool. |
Lastly, the Add Surface Information tool was used; placing the newly-created TIN files as the input surface. The original stockpile polygons were used for the input feature classes and also were where the resulting surface information was stored. The Z_MIN and Z_MEAN output properties were selected, but the Z_MIN is the only necessary property for the purpose of this analysis.
 |
| Figure 6: Add Surface Information tool. |
Results
Two maps were made from the information obtained throughout the analysis and a table containing the volumes of the three stockpiles from each of the methods used to calculate these volumes was created. The first map, figure 7, is one that shows the locations of each stockpile used with the DSM shown underneath.
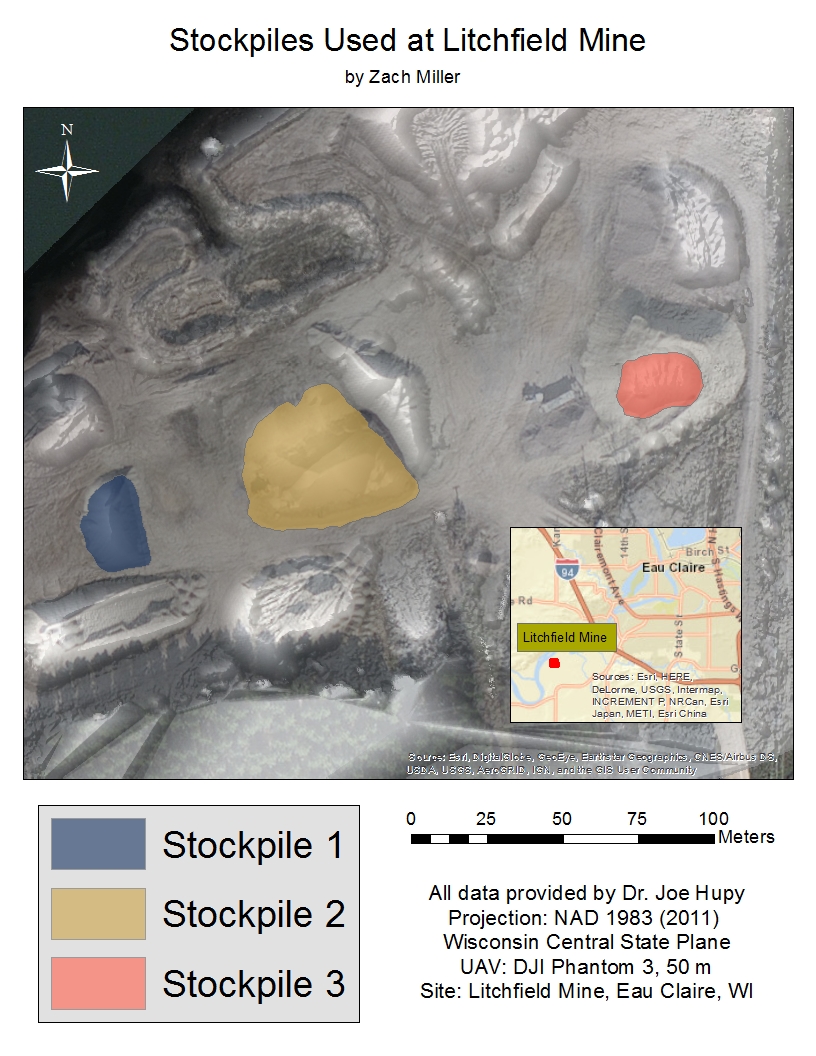 |
| Figure 7: A map showing the locations of each stockpile used in this analysis. |
 |
| Figure 8: A map showing the TIN elevations of each stockpile used in this analysis. |
 |
| Figure 9: Volume methods table in meters squared. |
Looking at the methods, these calculations were fairly easy to execute and the tool interface was quite user-friendly, which means calculating this very useful information could be learned by many and is easily accessible. Having a variety of calculation methods is also useful for applications in which the user might only have access to certain software or extensions within the software (ie. the 3D Analyst extension was used to access the Surface Volume tool in ArcMap). This technology could be extremely useful for mining, shipping, and other similar operations for ensuring accurate stock management or land use. Ensuring that the entire pile, as well as some area outside of the pile, is digitized is crucial to accurate volumetric data. In figure 7, it is clear that some of the area around pile 2 was left out of the shapefile and therefore the calculation. When digitizing in Pix4D, I found it difficult to determine the piles' extents and felt it might have been more accurate if I digitized the piles using the DSM in ArcMap instead. Otherwise it seems that all of the calculations are fairly similar to eachother, however I personally feel that the Surface Volume tool could yield the most accurate results. Because the Surface Volume tool uses a plane height specified by the user combined with a DEM or DSM, the volumes derived from that would be more accurate than just using the shapefile for the calculation extent combined with a raster or TIN, like one would with the Add Surface Information tool. In this assignment the TIN was used for the Add Surface Information and I feel as though that had an impact on the accuracy of the volume calculated, because the TIN file is not a direct representation of the surface, but rather a modified and simplified version. All in all, each tool for calculating volumes has the potential to serve its purpose in the specific parameters of the task and each tool was quite easy to use while also producing useful information.
No comments:
Post a Comment