Introduction
The purpose of this assignment was to learn about calculating surface imperviousness for spectral imagery. This was done in ArcGIS Pro and by segmenting imagery
Methods
All calculations and data manipulation done in this assignment were guided by ArcGIS Online's "Calculating Surface Imperviousness for Spectral Imagery" course. The first step was to segment the imagery. This involved extracting spectral bands 4, 1, and 3. This pulled the red and blue bands from the original imagery of the subdivision to better see differences in the land surface. Then the extracted bands image was segmented. This involved reducing the amount of spectral and spatial detail in the image, making it easier to classify the surface in the next step.
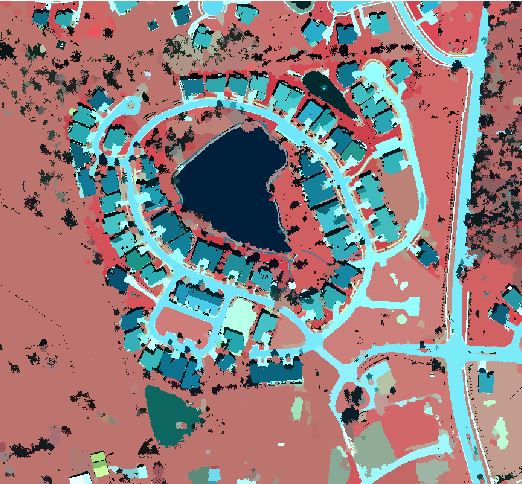 |
| Figure 1: Segmented Imagery |
To classify the imagery, the Louisville neighborhood and segmented images were dragged into ArcMap. The image classification tool was used to draw rectangles over houses, roads, driveways, bare earth, grass, water, and shadows all over the map. These seven categories would become the different classifications for the imagery.
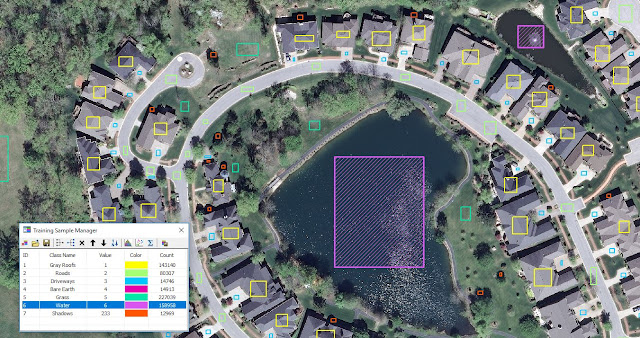 |
| Figure 2: Louisville neighborhood imagery with classes |
Next, in order to break down the imagery further, the reclassify tool was used to differentiate man-made and natural surfaces. Man-made surfaces were called "impervious" features and given a value of 0. The natural surfaces were called "pervious" features and given a value of 1.
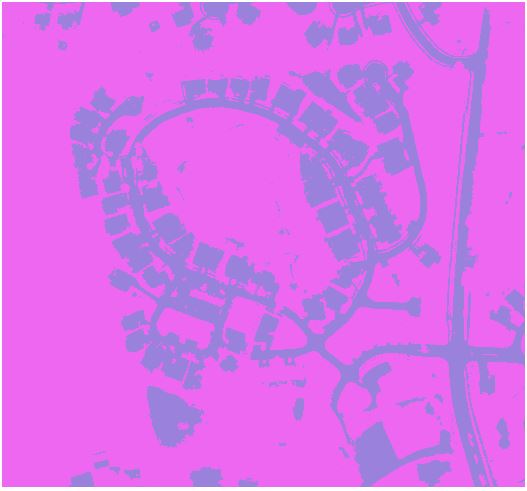 |
| Figure 3: Impervious and pervious imagery |
Next, the accuracy of the classification was assessed by looking at individual accuracy points for the imagery and the ground truth was corrected for the first ten points.
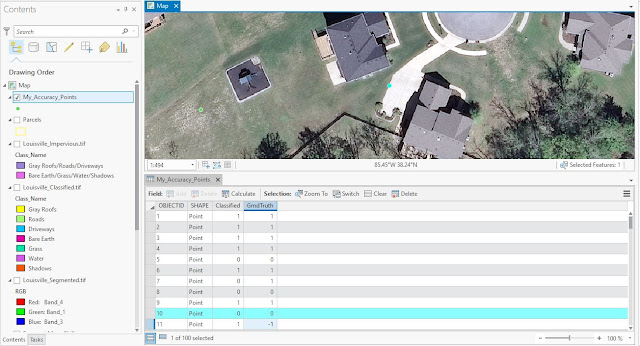 |
| Figure 4: Assessing ground truth |
Then, the confusion matrix was computed indicating the accuracy of the data classification. With 96 percent user accuracy, the data is reliable enough to use in the final production of the map. Before making the map, however the area of impervious surfaces must be tabulated and joined to the parcels layer. This computation would be used to assign each parcel within the subdivision a value of either grey roofs, roads, driveways, bare earth, grass, water, or shadows.
Once the data has been tabulated and joined to the parcels layer, the next step was to clean up any unnecessary fields as a result of the join. Lastly, a graduated colors symbology was chosen to differentiate which parcels represented which surface values defined earlier.
Result
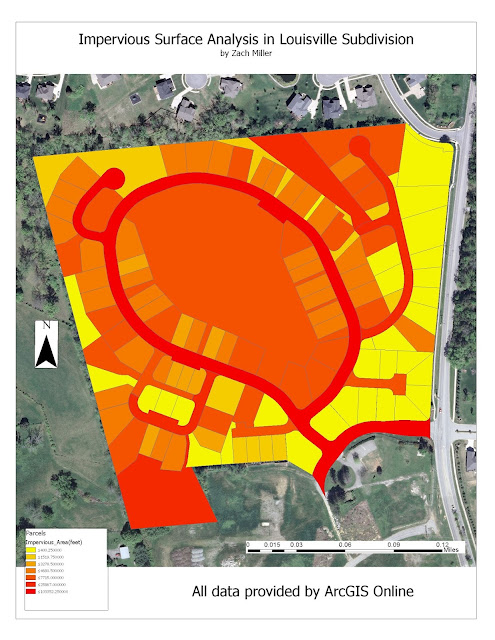 |
| Figure 5: Impervious area in feet |
As shown by the resulting map, this technology could be very useful to city planners, census applications, land surveying, and the list goes on. When the original image was simply an aerial photograph of the subdivision, it is pretty amazing that a map containing impervious area for each segment of the neighborhood was created. Doing the manipulation of the imagery was fairly easy and user friendly as well, meaning that it can be widely accessible and accurately used.


No comments:
Post a Comment